


InnoGames’ Senior Performance Marketing Manager, Deniz Kekeç, explains how she created an incrementality tool by building a framework through experimentation and analysis.
Deniz’s note:
“Hey, I’m Deniz, a data-savvy performance marketer deeply engaged in exploring marketing effectiveness.
I’m excited to share that I’ll be speaking about this topic at Mobidictum this year. Feel free to reach out if you have any questions or need further insights.
Looking forward to seeing you in Istanbul!“
A few months back, I published an article on marketing effectiveness, where I explored how different marketing strategies contribute to business outcomes—with an emphasis on revenue. I introduced the concept of incrementality and shared various approaches for testing it in online campaigns.
In this article, I focus on the results from my tests with selected UA partners and how I evaluated their impact on organic growth. My approach centers on building an incrementality framework through a combination of experimentation and analysis, refining methodologies, and applying models to diverse datasets. I will walk you through the process and share findings specific to organic growth.
The next chapter will explore the impact on revenue, and the final chapter will synthesize these insights into comprehensive conclusions.
Test Methodology
Understanding the interplay between paid marketing channels and organic growth is critical for optimizing media allocation. For this experiment, I conducted in two distinct markets provide valuable insights into how Channel 1 and Channel 2 influence organic app installs. By comparing results across geographies, I hope better to isolate incremental impact and refine channel strategies. I chose the stable event calendar for this test. This helps minimize the effect of any organic uplift that might naturally come from the event or other campaigns, ensuring cleaner results.
- Experimentation – running geolift tests with selected partners and running regressions on these data.
- Analysis – feeding the results into a custom-built tool for deeper analysis.
Here’s how I set it up:
- Markets: I selected Tier 2 markets that aren’t our core markets, so any test impact wouldn’t significantly affect overall performance. Let’s call them Market 1& 2.
- Ad Partners: Each of the two markets was tied to a separate ad partners to keep the test structure controlled
- Controls: To reduce noise, I made sure these markets weren’t included in any other UA campaigns, featuring, or social promotions on Android during the test period.
The objective was to scale installs during the test on selected 2 partners and observe how that scaling related to organic growth in the same markets until each test reached a significance level.
Based on our CPI benchmarks, I planned a two-week test period to ensure a minimum of 500 installs per campaign, with the potential to reach up to 1,000. Later, the results from this geo test will then be compared with historical data to validate and contextualize the findings.
Choosing the Right Data
At the core of regression analysis is understanding the impact of inputs on outputs. In most cases, that means measuring how marketing sources contribute to total revenue and install lift.
For this setup, I looked at:
- Inputs → Daily installs and spend at the source level.
- Outputs → Organic installs
The objective was to measure how much daily organic traffic I could generate without any influence from social media, featuring, or paid user acquisition. For the regression analysis, I used their daily install data and compared it with organic performance during the test period to isolate true organic behavior.
To strengthen the analysis, I considered not only the two-week test window but also the two weeks prior. This expanded timeframe provided more data points and helped establish a clearer picture of organic trends before the pause period.
Analysis & Results
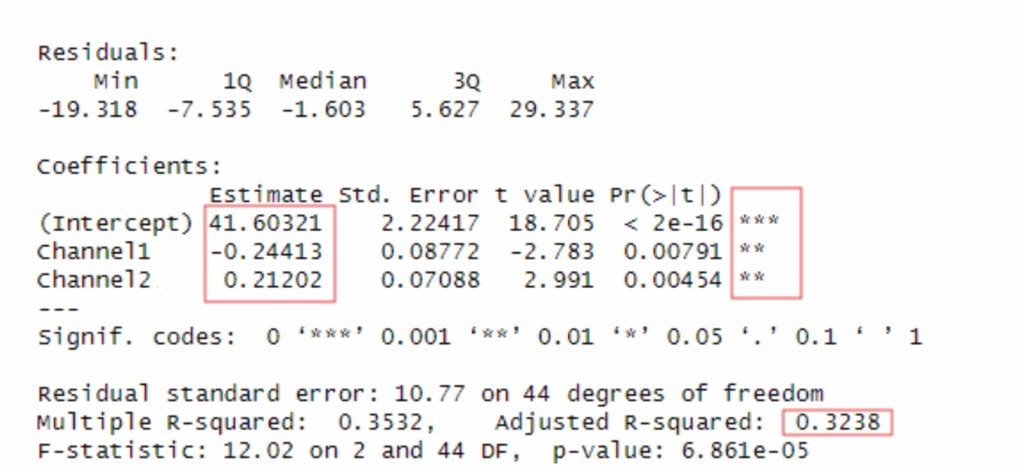
Test in market 1:
In Market 1, regression analysis indicates that daily organic installs average around 42 per day (Intercept = 41.6, p < 0.001) when controlling for other channels.
- Channel1 has a negative and significant effect (Estimate = -0.24, p < 0.01), suggesting that increases in this channel are associated with reduced organic installs.
- Channel2 has a positive and significant effect (Estimate = +0.21, p < 0.01), indicating that activity in this channel contributes to organic uplift.
The model explains about 35% of the variance (R² = 0.35, Adj. R² = 0.32), with an overall F-test confirming statistical significance (p < 0.001). Overall, these results show that organic traffic in Market 1 is meaningfully influenced by activity in both channels, though in opposite directions.
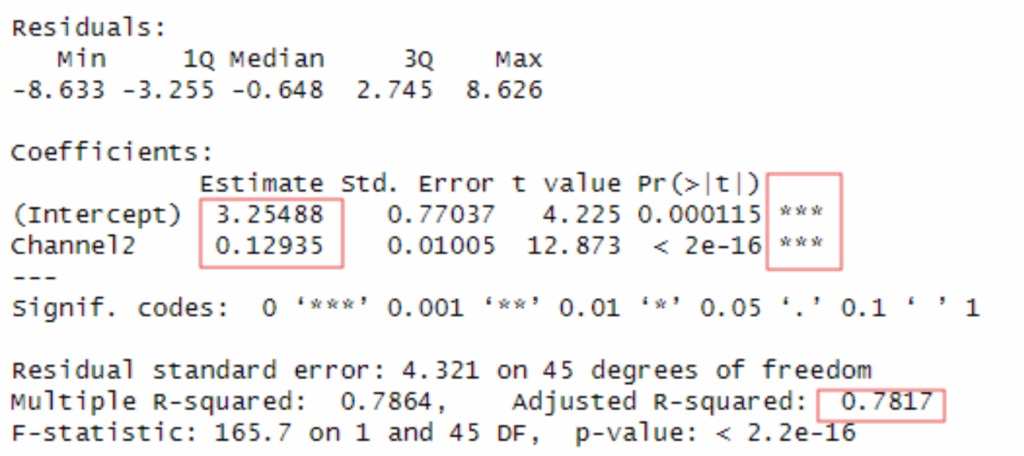
Test in Market 2:
In Market 2 , regression results show that organic installs are strongly and positively associated with Channel2 activity.
- The intercept suggests a baseline of about 3.25 daily installs (p < 0.001).
- Channel2 has a highly significant positive effect (Estimate = +0.13, p < 0.001), indicating that increases in this channel are strongly correlated with higher organic installs.
The model explains a substantial portion of the variance (R² = 0.79, Adj. R² = 0.78), with an overall F-test confirming high significance (p < 0.001). Overall, the results highlight Channel2 as a key driver of organic growth in Market 2.
Channel 2 seems to have a stronger inclination towards organic growth, whereas Channel 1 remains uncertain. To gain more insight, I decided to examine historical data from the period before the test when both Channel 1 and Channel 2 were active.
Historical Data Comparison:
I conducted a historical data analysis using quarterly data from Android, focusing specifically on T1 market data. In this analysis, I incorporated featuring as a variable, treating it as a binary metric (featured vs. not featured).
One of the challenges of this approach is that the uplift from featuring can overlap with the performance of user acquisition (UA) campaigns, as algorithms tend to respond to sudden increases in visibility.
If your app frequently appears in a featured position within a subpath, it is beneficial to also examine category-specific featuring positions to more accurately gauge the impact on visibility. However, for the purposes of this article, I will maintain a high-level overview and not delve into the specifics of those category-based features.
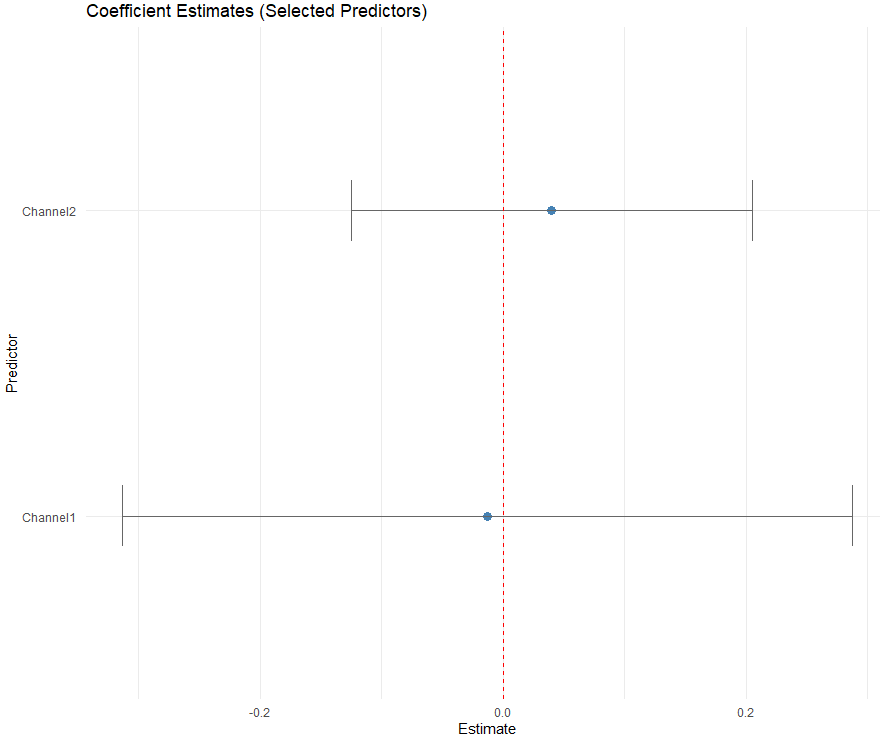
Analysis of the linear regression model indicates that Channel 1 has a negative coefficient, while Channel 2 has a positive coefficient; however, neither is statistically significant. Examination of historical data suggests that Channel 1 may exhibit fluctuating or inconsistent effects across different periods or datasets, which likely contributes to its lack of significance compared to Channel 2.
Overall, the evidence points to limited incremental value for Channel 1, warranting careful evaluation before additional investment. In contrast, both geolift tests and historical data consistently show that Channel 2 contributes positively to organic growth, highlighting it as a reliable and scalable channel for driving installs.
Comparison between Geo Lift and Historical Data:
Looking at this example historical data, Channel 1 could be experiencing fluctuating impacts or effects that are not consistent across different datasets or over time, explaining the uncertainty.
Channel 2’s stronger inclination towards growth in the GeoLift test suggests that there might be specific conditions or factors (geographic, demographic, or temporal) under which it performs well, potentially masked in the broader regression model by other variables or noise.
Rethinking Channel Allocation & Next steps:
Algorithms are complex, and evaluating marketing effectiveness is not a one-time exercise; it requires multiple tests and analyses across different time periods, markets, and campaigns. Based on these early results, I would not recommend that a marketer immediately reduce investment in Channel 1 or increase spend in Channel 2.
As noted earlier, the goal of this project was not to draw definitive conclusions after the first month of testing. Most importantly, these initial findings provide clearer guidance on where to focus and what questions to ask in the second round, enabling more meaningful insights in subsequent analyses.
- Analyze different datasets, altering the timeframe, platform, and market and breakdown in campaign level data.
- Investigate whether Channels 1 and 2 exhibit different dynamics across various markets by including revenue.
- Try different analysis methods like Interrupted Time Series Model.
- Examine their performance under different campaign models and optimization strategies.
- Implement subgroup analyses particularly focused on the featuring variable to enhance model fit and potentially improve the R-squared value.
By iteratively refining hypotheses and expanding the analysis, this project aims to produce actionable insights that can better inform channel allocation and strategy. Future installments will continue this exploration, moving from organic growth to revenue impact, and ultimately synthesizing lessons into a comprehensive framework for measuring marketing incrementality.

Sr. Performance Marketing Manager at InnoGames