
Shopping app marketers face growing competition for both consumer attention and conversions. In the first eight months of 2026, the number of shopping app advertisers reached 30,909, exceeding the full-year 2024 total. As the holiday shopping season approaches, brands need to balance acquisition with retention, reaching shoppers before traffic costs peak and giving them reasons to return after their first purchase.
To help marketers navigate this landscape, SocialPeta and Jampp have jointly released the 2026 Shopping App Marketing Trends and Insights. The report examines the advertising trends, creative strategies, and shopping behaviors shaping growth opportunities.
Industry Overview: Advertiser Numbers Nearly Double as Ad Activity Recovers
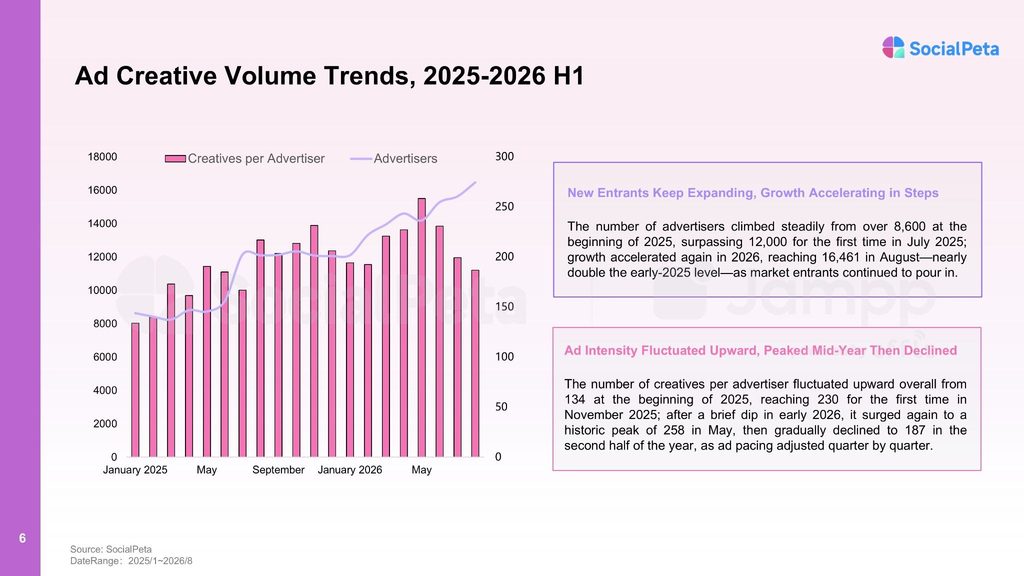
After a period of consolidation in 2025, shopping app advertising rebounded in 2026.
- Active advertisers nearly doubled, rising from over 8,600 in early 2025 to 16,461 in August 2026.
- The total advertiser count for the first eight months of 2026 surpassed the full-year 2024 figure, signaling renewed market expansion.
- Average creative volume per advertiser approached 2024 levels, pointing to a steady recovery in advertising activity.
Global Landscape: Europe and North America Lead as Image Ads Regain the Top Spot
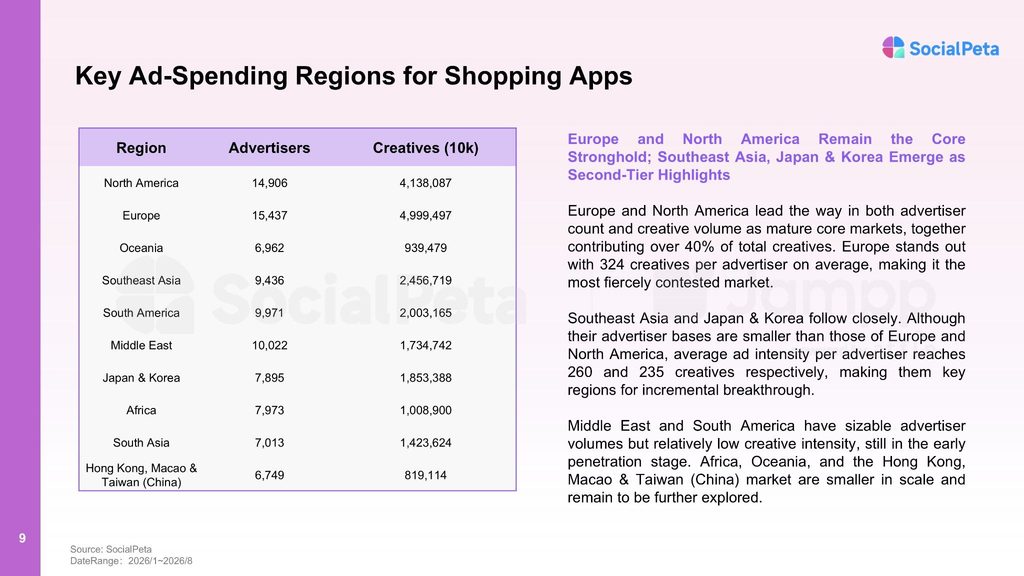
Europe and North America remain the leading markets, with 15,437 and 14,906 advertisers, respectively. Together, they account for over 40% of creative volume across the top 10 regions. Europe is the most competitive market, averaging 324 creatives per advertiser. Southeast Asia and Japan and South Korea form the second tier, with 260 and 235 creatives per advertiser, respectively.
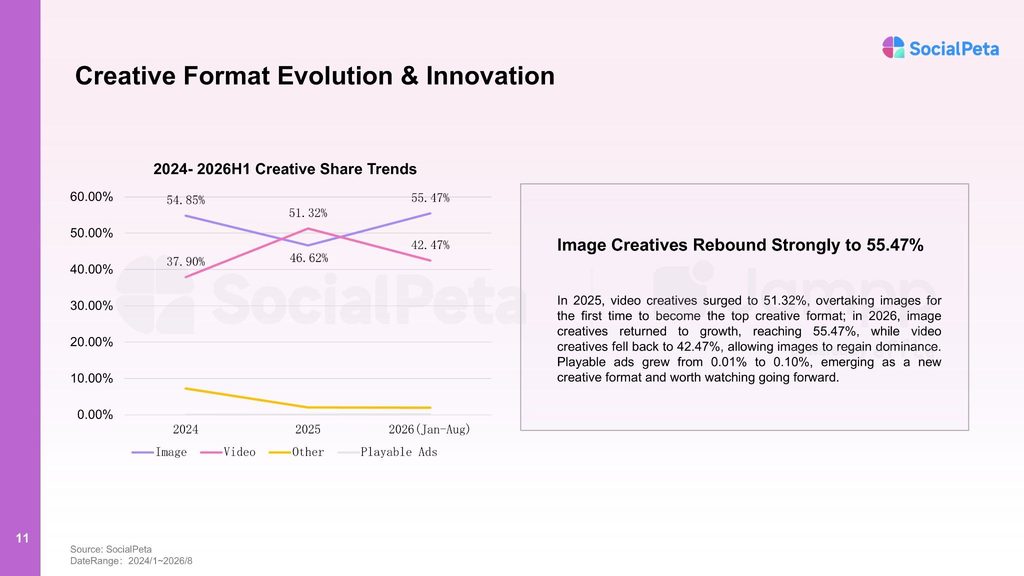
In 2025, video creatives surged to 51.32%, overtaking images for the first time. In 2026, however, image creatives rebounded to 55.47%, while video declined to 42.47%, putting images back in the lead.
By channel, the Meta ecosystem, including Facebook and Instagram, holds the largest share at 51.05%, followed by Google at 31.80% and TikTok at 8.15%. English-language ad copy dominates, accounting for 77.43% of the total.
Advertiser Landscape: Three Distinct UA Playbooks
The report takes a closer look at three representative shopping app advertisers:
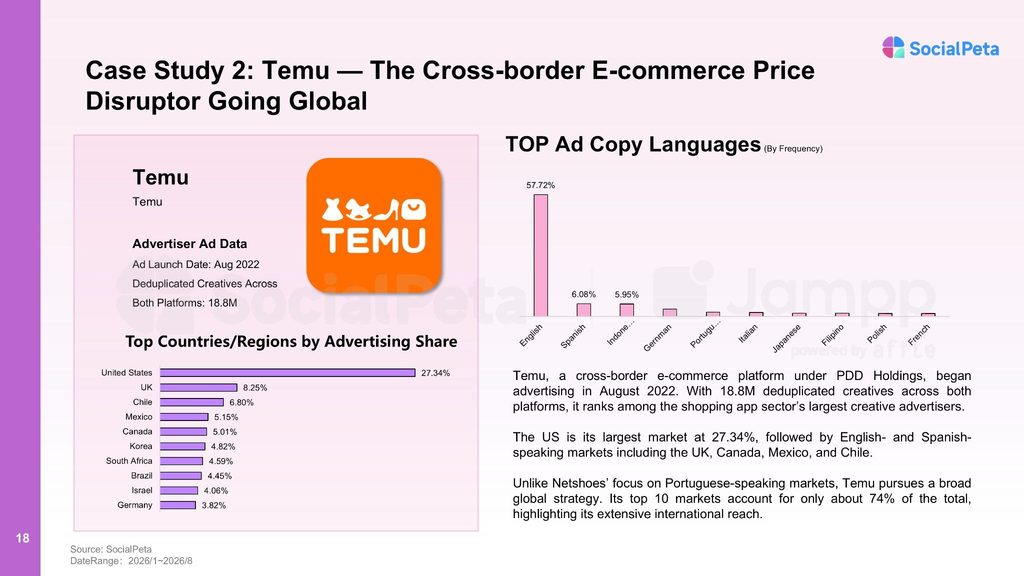
Temu: The cross-border marketplace has accumulated 18.8 million deduplicated creatives across Android and iOS. English accounts for 57.72% of its ad copy, while the US is its largest market at 27.34%. Its approach combines large-scale global advertising with a strong focus on competitive pricing.
Netshoes: A leading Brazilian sports e-commerce platform with a strong presence across Portuguese-speaking markets. Brazil accounts for 66.15% of its market distribution, followed by Portugal at 62.48%.
Callie: An emerging personalized gifting app that began advertising in March 2026. French accounts for 45.55% of its ad copy, reflecting its focus on French-speaking markets and premium personalized gifts.
The full report also includes detailed breakdowns of top-performing creatives from all three advertisers, the top 10 Android and iOS advertiser rankings, ad copy language trends, and more.
Q4 Traffic Costs: December CPMs Rise 77% Above June Levels
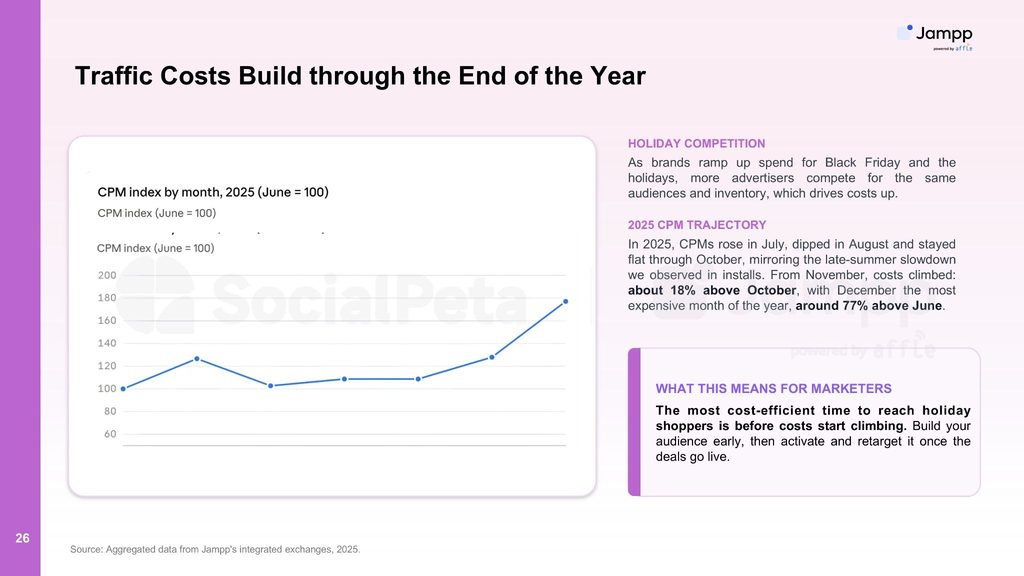
These figures highlight the cost pressures marketers need to prepare for in Q4:
- In November 2025, CPMs were approximately 18% higher than in October.
- December was the most expensive month of the year, with CPMs around 77% higher than in June.
- Shopping app installs slowed seasonally toward the end of Q3, while CPA climbed throughout August and ended the quarter at its highest level.
As Rochi Vivot, Vice President of North America at Jampp, puts it: “The brands that do best in Q4 are the ones that prepare before the competition does.”
In other words, the most cost-efficient time to reach holiday shoppers is before Q4 competition drives prices higher.
Consumer Behavior: 55% of Users Buy Within 24 Hours, but Only 1 in 8 Returns for a Second Purchase
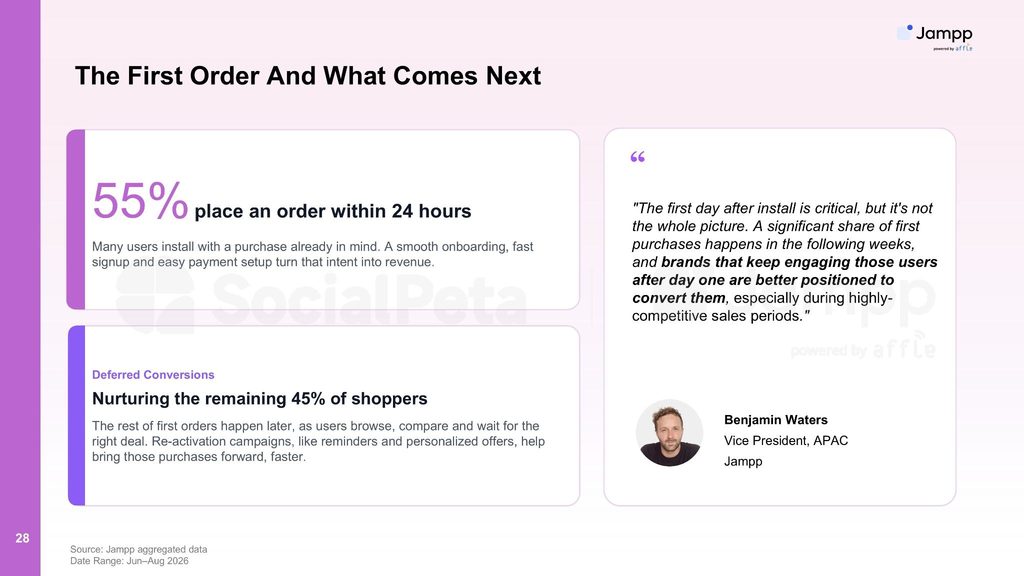
55% of users place their first order within 24 hours of installing the app, suggesting that many already have a purchase in mind. A smooth onboarding and checkout experience is therefore essential.
Only 1 in 8 first-time buyers makes a second purchase within 30 days. With repeat purchases relatively rare, retargeting plays a critical role in increasing LTV.
Featuring 30+ pages of research, creative analysis, and practical recommendations, this report helps shopping app marketers, e-commerce brands, and UA teams make informed growth decisions. Download the full report to refine your campaigns and build customer loyalty beyond the holiday season.